

The September Slump & Santa Claus Rally
How monthly market patterns stack up against today’s economic backdrop

When we look back nearly a century, patterns emerge in stock market performance.
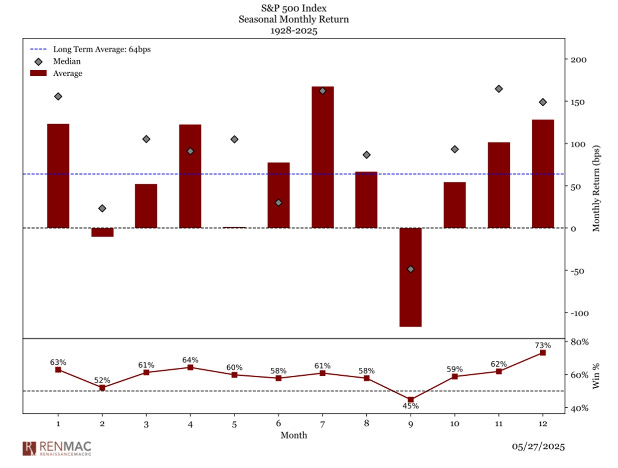
One pattern is the S&P 500 has “favorite” and “least favorite” months.
The first chart highlights the median and average monthly returns since 1928. November and December are historically strong performers, while September is consistently the weakest month.
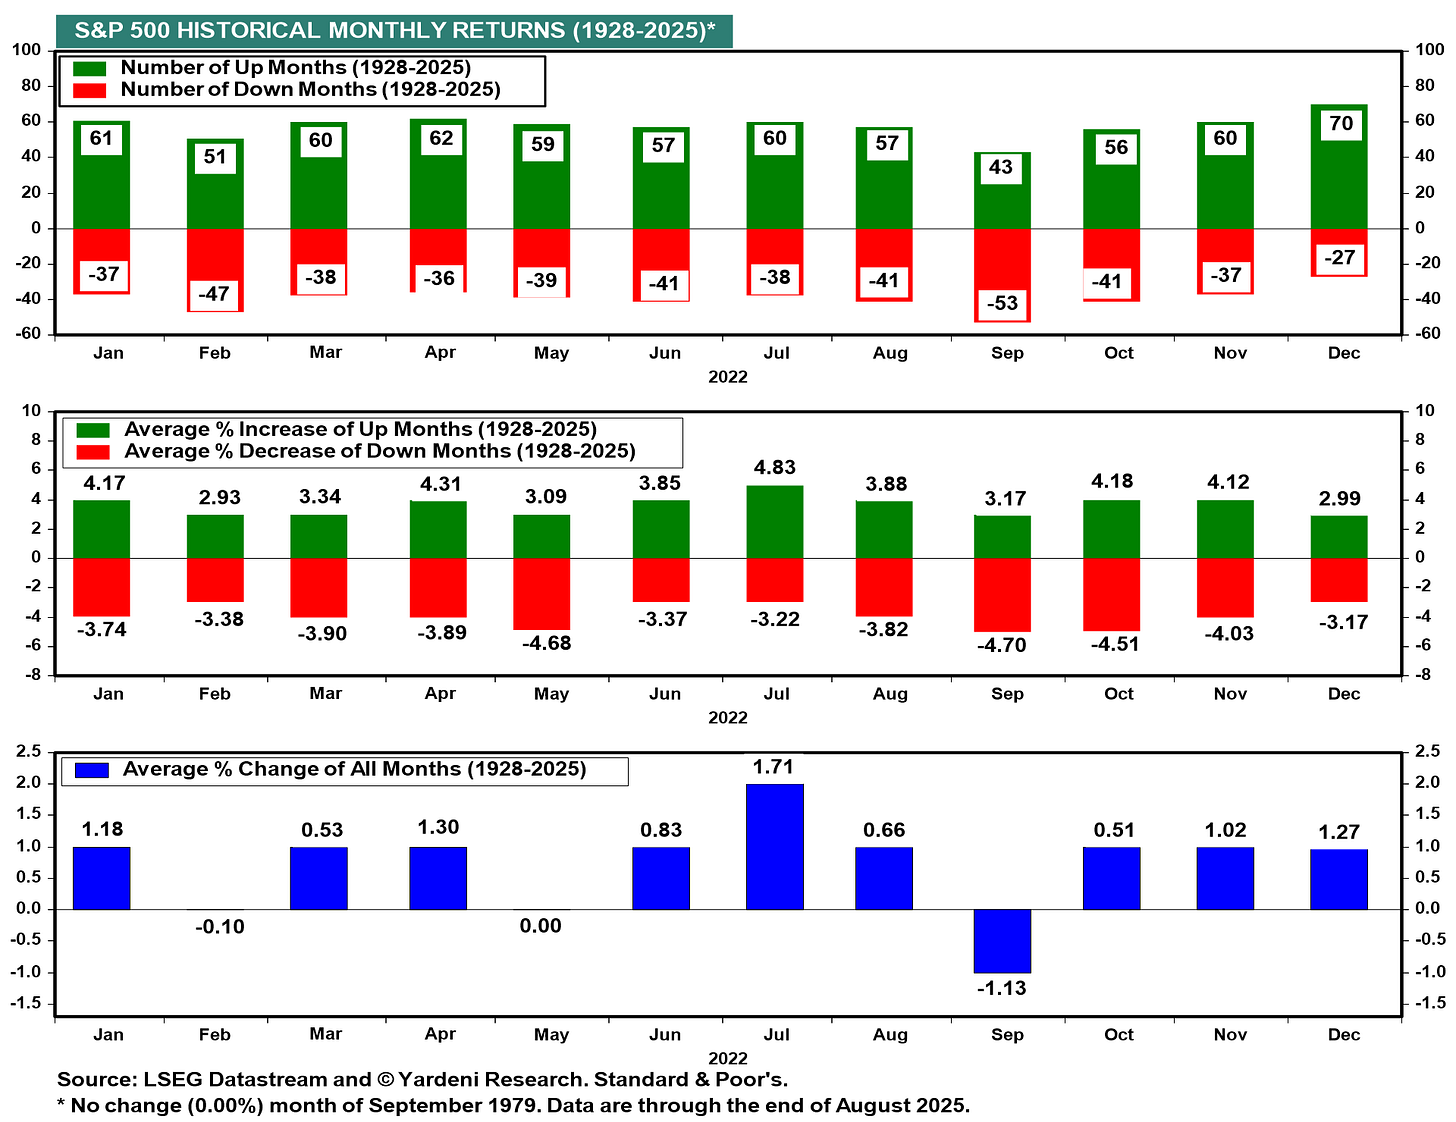
This second chart breaks it down further:
December has been the most reliable month, positive 70 times since 1928.
September stands out as the laggard, with more down months than up months.
On average, markets rise ~1% per month, with July and December often delivering outsized gains.

Why This Matters Today
These seasonal tendencies are useful context, but they don’t tell the whole story:
The economy is still expanding. Growth and employment remain resilient.
Inflation is sticky but cooling, shaping expectations for Fed policy.
Markets are near record highs, driven by strong earnings.
Election-year uncertainty could amplify volatility in the months ahead.
While September may live up to its reputation, investors should remember: markets follow fundamentals, not the calendar.
Key Takeaway
History shows that seasonality can tilt probabilities, but successful investing comes from discipline, diversification, and patience — and not trying to time the market based on the month.
A disciplined, long-term strategy remains the best way to build and preserve wealth. Align it with your financial plan and you are setup for success.