

Locked In by Low Rates
How high mortgage rates are freezing families and reshaping housing

Today’s topic hits close to home—literally. 🏠
A powerful trend has taken root across the U.S. = homeowners are staying put like never before. Thanks to steep mortgage rates, intense affordability challenges, and shifting market dynamics, we’re seeing a historic level of “lock‑in.”
Let’s explore three charts below that illuminate this trend and what it means moving forward.
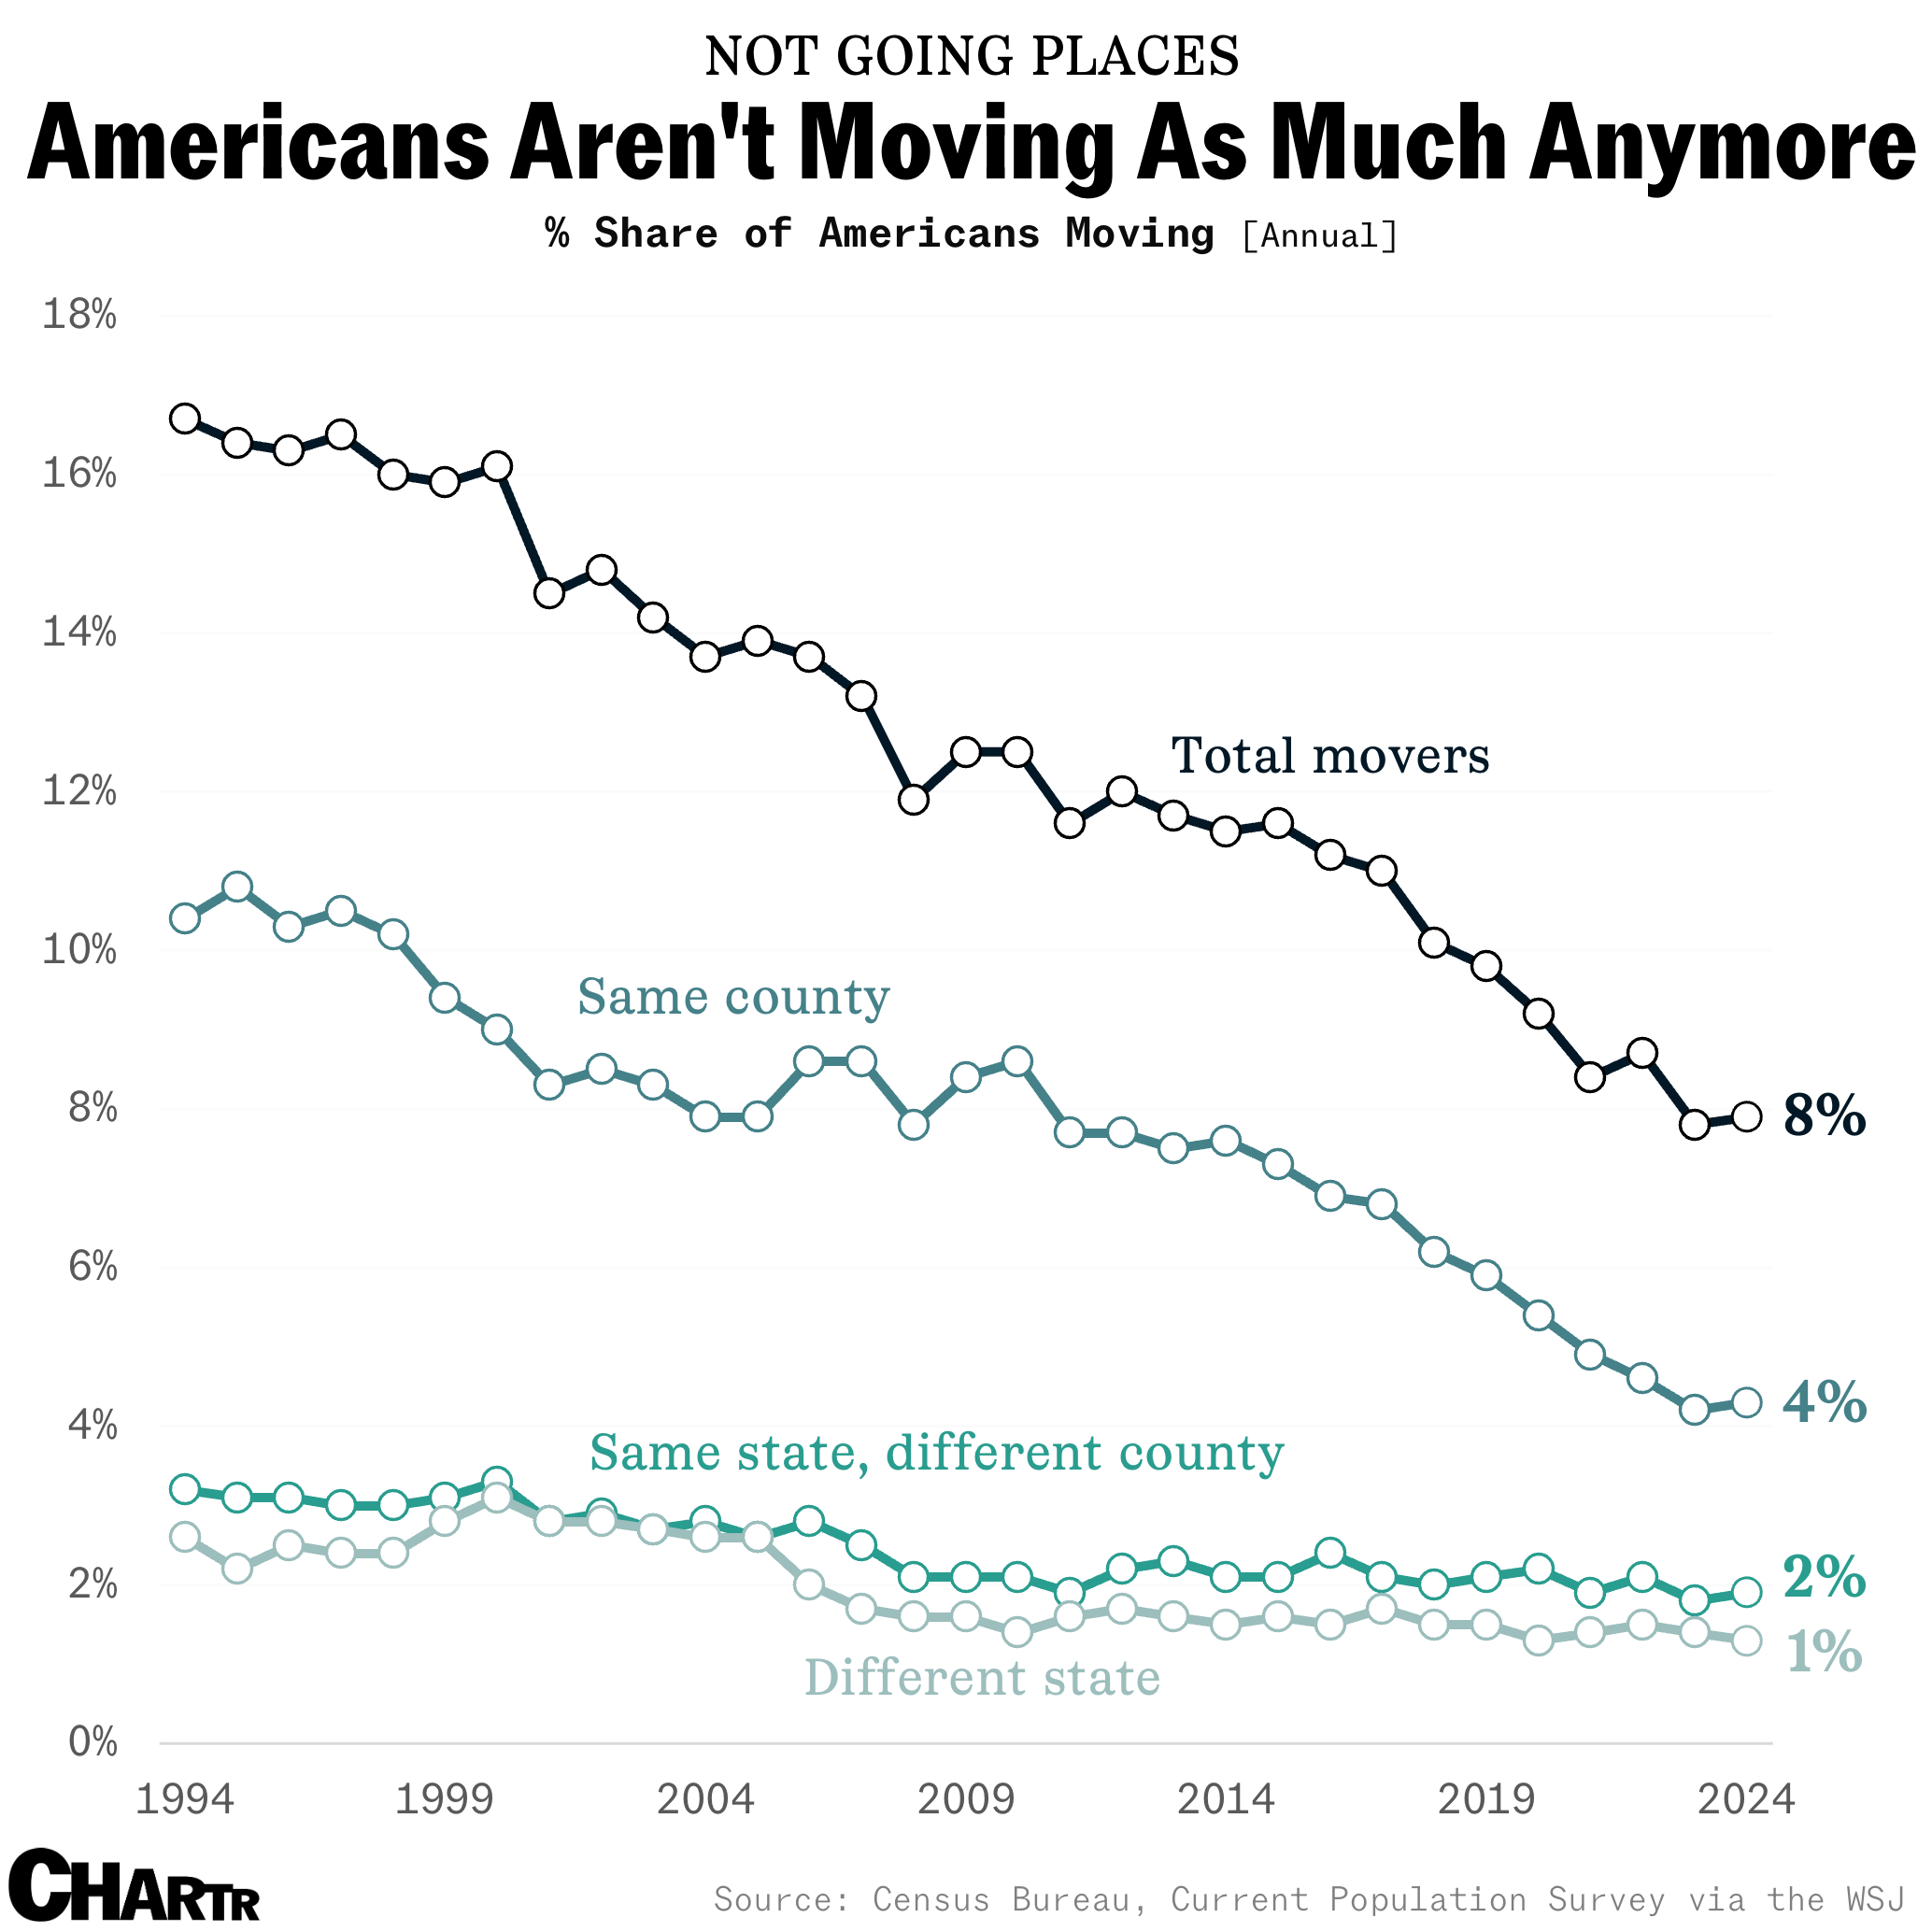
1. Fewer Americans Are Moving
The first chart shows a clear, long-term decline in mobility among U.S. homeowners. Whether due to economic, social, or structural shifts, Americans are moving far less frequently than in previous decades. The downward trajectory hints at deeper friction within housing and labor markets, friction that’s only intensified lately.
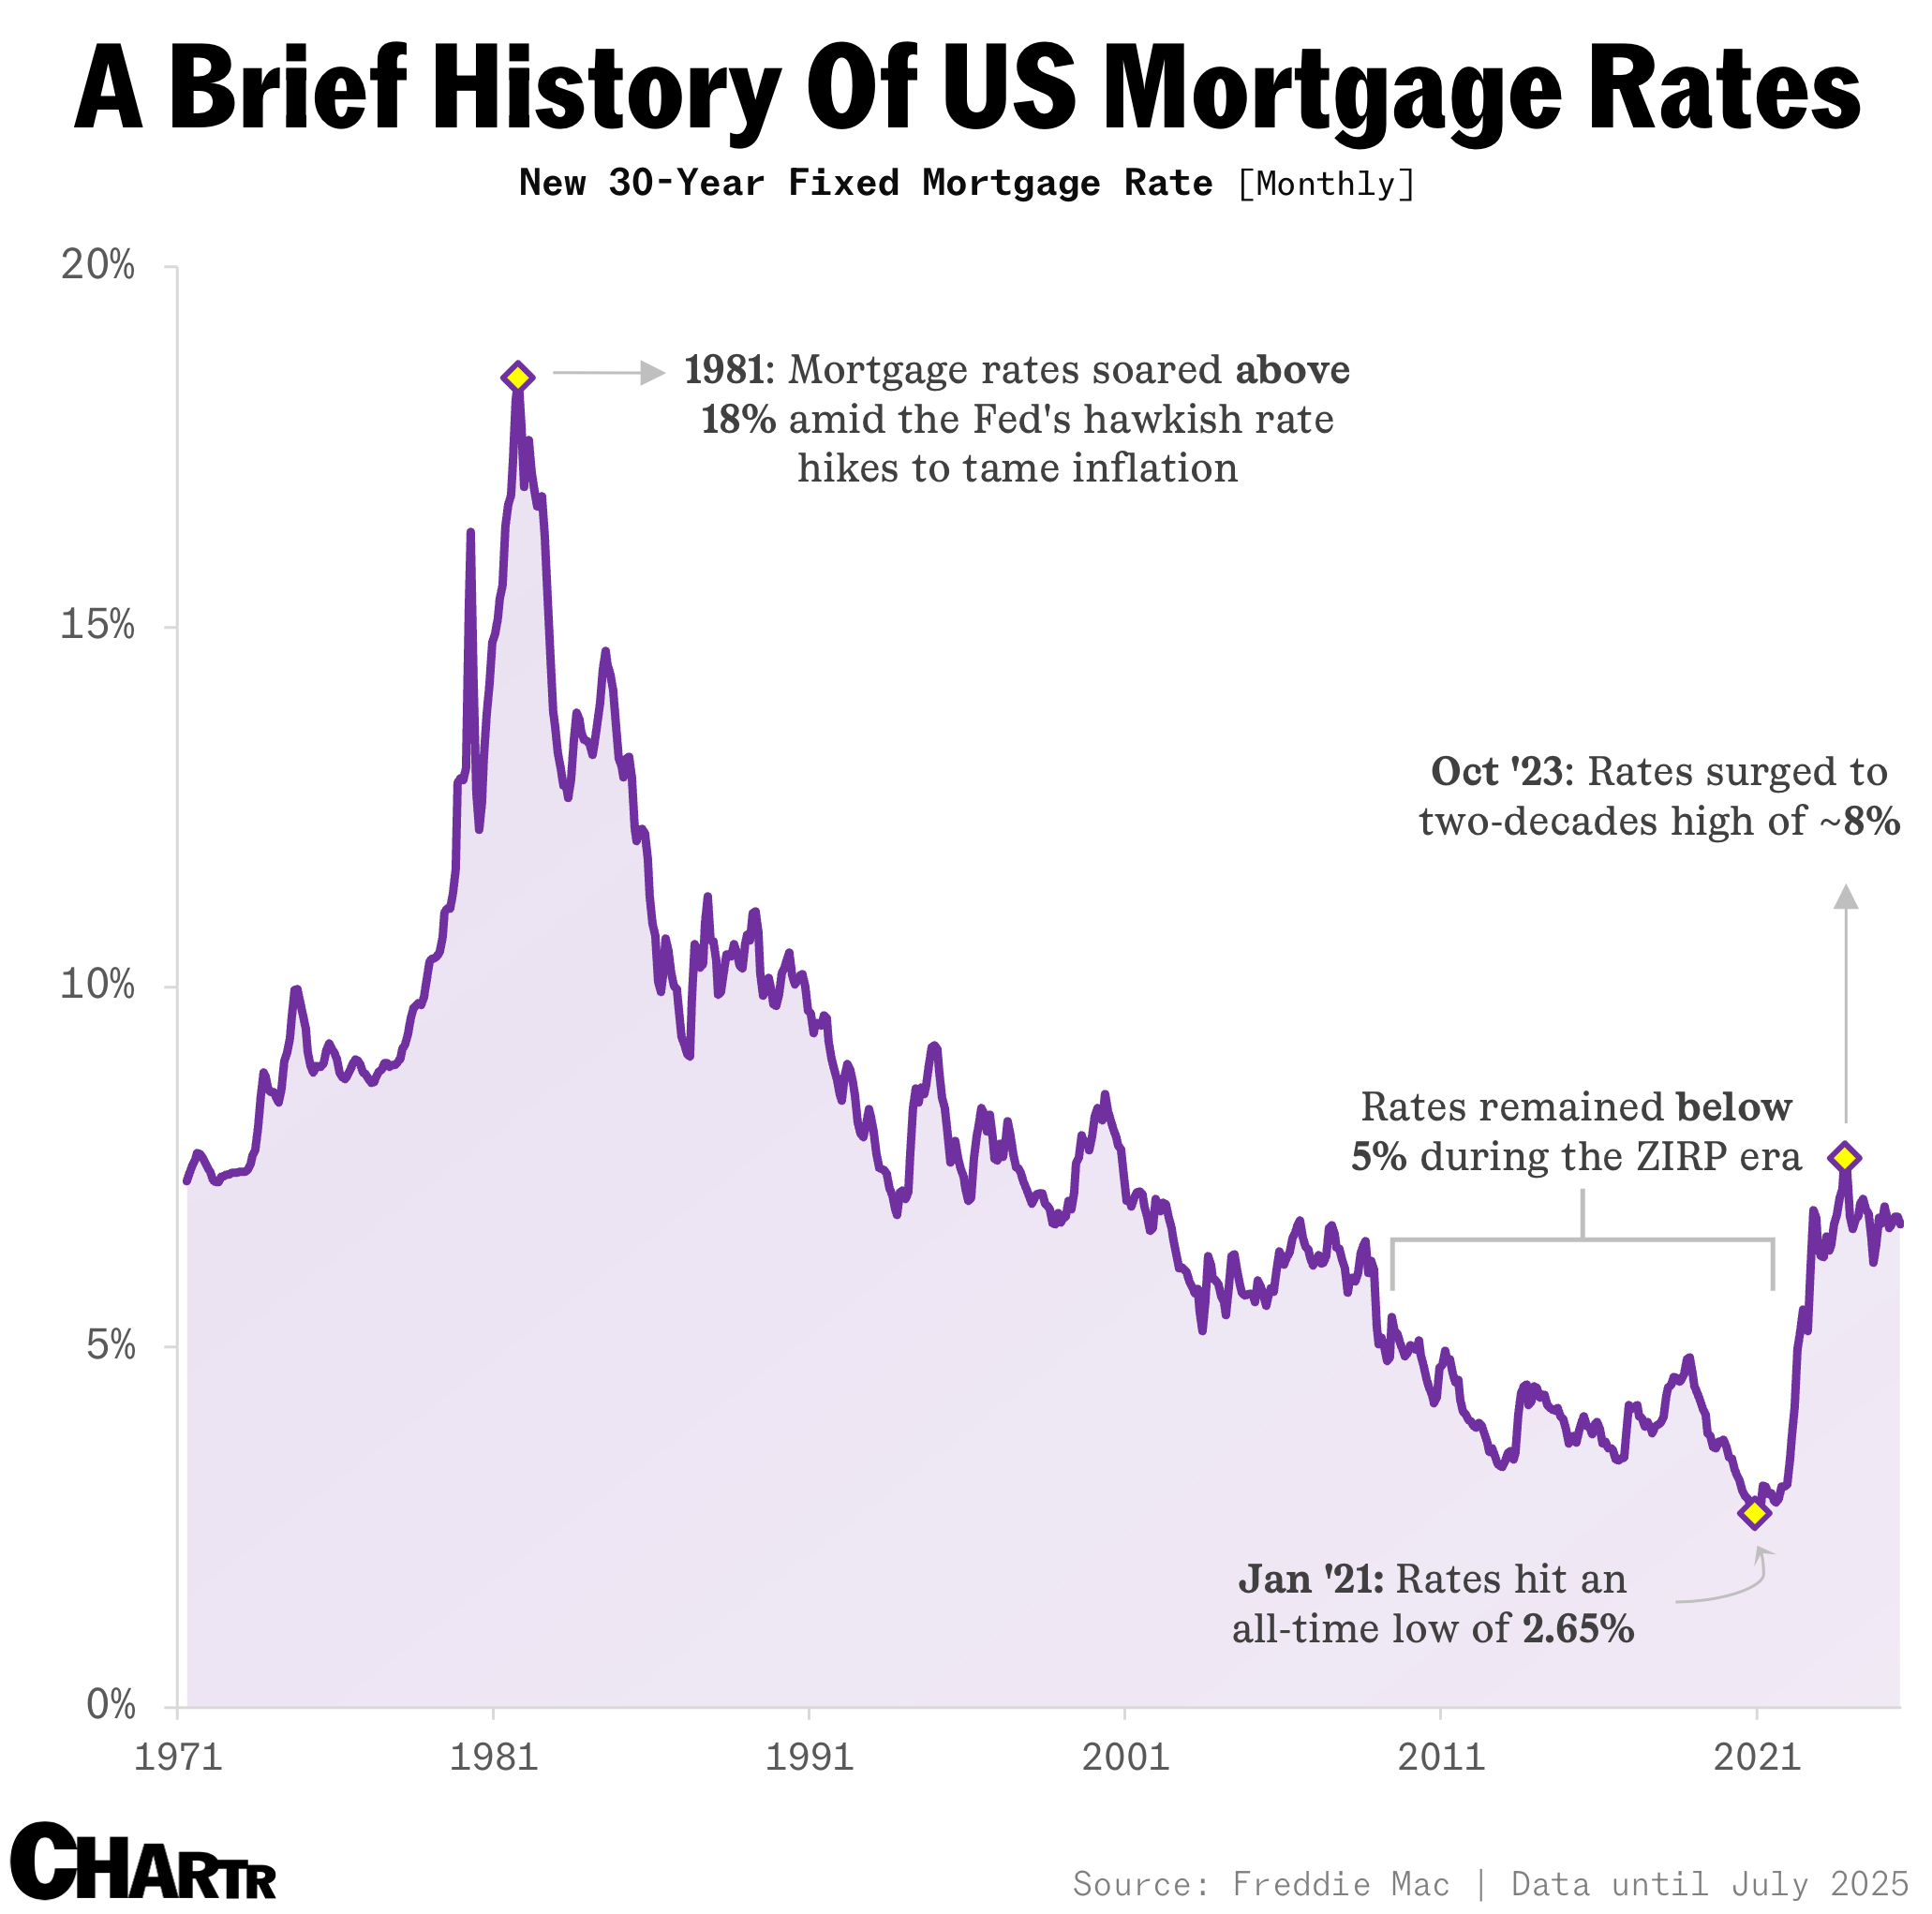
2. Mortgage Rates That Freeze Movement
Next, the mortgage rate chart paints a telling story: current averages hover near 7%, a striking contrast to the much lower rates available to many existing homeowners. These low, locked-in rates (often from early pandemic years) act as financial anchors that discourage moves, even when change might be desired.
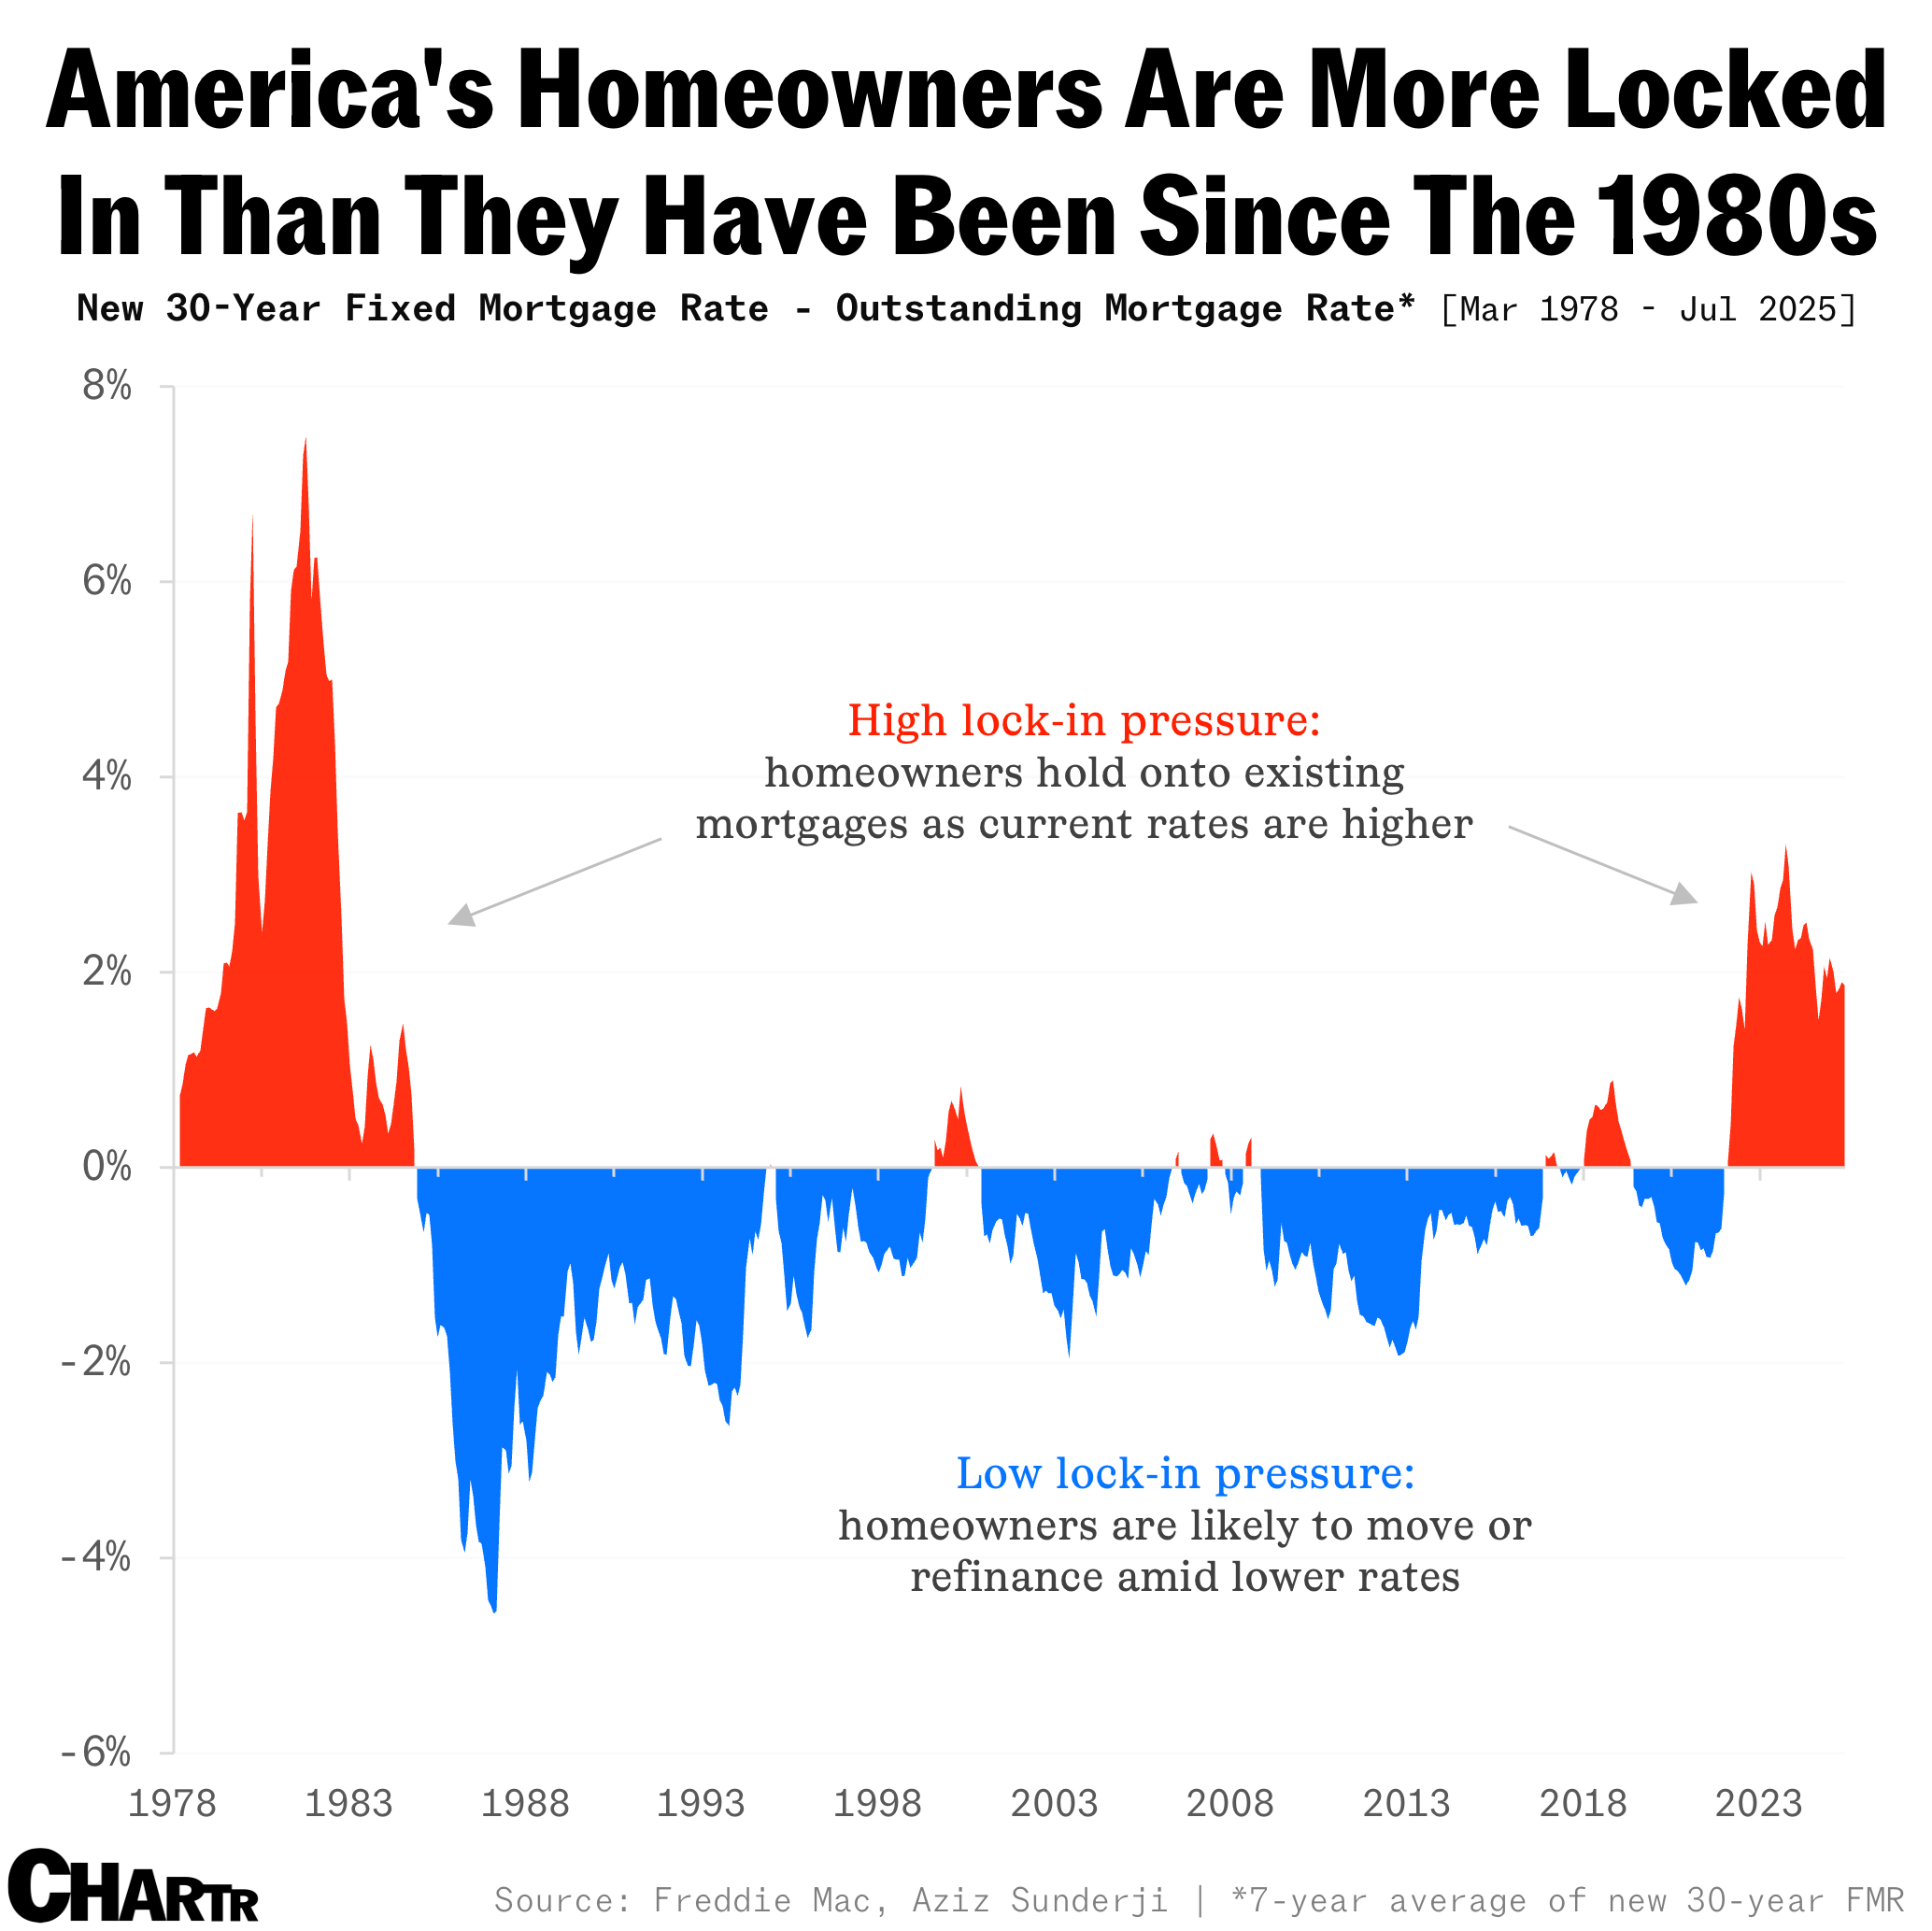
3. Homeownership Amid Evolving Market Forces
The third chart offers a broader view: homeowners today are navigating an entirely different environment from their counterparts 40 years ago. Lower mobility, coupled with shifting affordability and demographic trends, has reshaped patterns of ownership and market fluidity.
Why This “Lock-In” Matters
🚧 Stalled Housing Supply
Because homeowners with low mortgage rates are reluctant to sell—and buyers face daunting new rate environments—inventory remains tight. This scarcity exacerbates affordability issues for newcomers to the market.
🚧 Wages and Jobs Take a Hit
With fewer people moving, job flexibility suffers. In many cases, potential relocators are choosing costly mortgages over better opportunities, limiting job mobility and workforce dynamism.
🚧 Economic Ripple Effects
From real estate professionals to contractors, many service industries linked to home turnover are experiencing contraction. The lock‑in effect isn’t just about homes—it’s about economic inertia across sectors.
What’s Fueling the Lock-In?
Steep Rate Disparity: Many homeowners locked in rates below 4%, while new mortgages hover near 7%. That gap makes moving financially painful.
Affordability Collapse: Home prices have surged while mortgage costs spike, moving isn't just a hassle, it’s oftentimes financially impractical.
Demographic Shifts: Older homeowners, especially, now hold mortgage-free homes, further reducing listings and market churn.
What Could Break the Freeze?
Lower Mortgage Rates: Even modest declines toward 5% could ease the gap for many and nudge hesitant homeowners to consider moving.
Supply-Side Reforms: Simplifying permitting, relaxing zoning, and boosting new construction (especially of single-family homes) could inject much-needed inventory into the market.
Incentives for Turnover: Programs such as relocation credits or buy‑down initiatives (used successfully by large builders) might help unlock the market for more homeowners.
In Summary
These charts and data combine to tell a compelling story: high-rate “golden handcuffs,” declining affordability, and market inertia are keeping Americans put.
The effects ripple through housing supply, labor mobility, and the broader economy.
Yet, cracks may be forming in the freeze as lower rates, policy cures, and creative financing could begin chipping away at the lock‑in. As advocates, professionals, and individuals, monitoring these shifts (and acting when opportunities arise) could make all the difference.
Sources:
Nobody’s Buying Homes, Nobody’s Switching Jobs—and America’s Mobility Is Stalling - Wall Street Journal (read here)
US homeowners are more locked in than they’ve been for 40 years - Sherwood News (read here)