

A Confusingly "Good" Market Environment
Why this rally still feels so hated and what history is showing us

If you’ve been trying to make sense of what’s been happening in the stock market over the past year, you may have found yourself feeling a bit confused.
It’s understandable, given that the last year has been filled with plenty of news, both good and bad. While most everyone is thankful for a rising market, the market’s willingness to ignore the negative headlines has baffled many investors.
Here are just a few recent data points from both sides to help illustrate the confusing nature of our recent experience:
On the good side:
Stock prices are at, or near, all-time highs.
Corporate earnings are rising.
The economy (seemingly against all odds) is growing.
Companies are investing in their future.
Average hourly earnings growth has outpaced inflation for 26 straight months.
New businesses are being established at one of the highest rates this century.
Consumers continue to spend beyond the pre-pandemic trendline.
On the bad side:
Consumer sentiment is awful.
Valuations are quite high, especially for the companies driving much of the market’s recent growth.
The dollar is struggling.
Unemployment is starting to creep up.
The Fed seems poised to cut rates due to the weakening labor market.
Inflation has been above the Fed’s 2% target for nearly five years now.
Tariffs remain a wild card with uncertain consequences.
So yes, some things look very good, while at the same time it can feel like we’re circling the drain.
What History Says About Rate Cuts
JPMorgan research recently highlighted something remarkable:
The Fed has cut interest rates with the S&P 500 within 1% of all-time highs 16 times in history.
Every single time — 100% of the time — the market was higher a year later, with an average return of nearly 15%.

Expanding the scope: whenever the Fed has cut rates with the S&P 500 within 2% of all-time highs, the index finished higher 20 out of 20 times (100% hit rate) over the following 12 months.

That doesn’t mean this time will be identical, but it’s a powerful historical pattern worth paying attention to.
Strong Q2s (historically) Set the Tone
Another dataset: when the S&P 500 gains more than 10% in the second quarter, the rest of the year has been higher 85% of the time since 1950.
That’s exactly what we’ve seen this year and so far, it’s worth remaining optimistic.

Tom Lee says This is still a Bull Market
While history offers some perspective, forward-looking research also matters. Tom Lee of FundStrat has been one of the most accurate strategists throughout this cycle, and his latest update leans bullish once again:
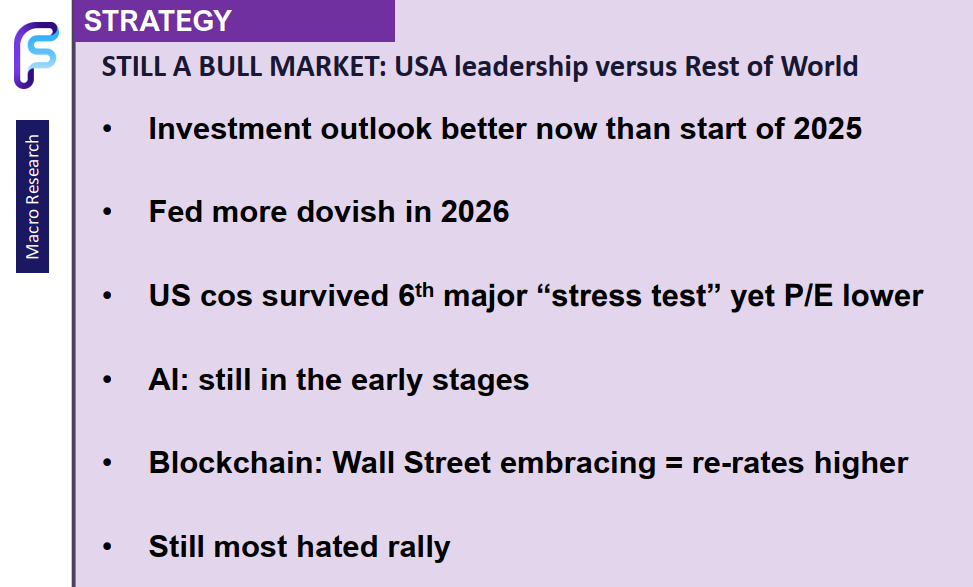
Why This Matters
This is what makes today’s market environment so challenging: the headlines don’t match the tape. Skepticism is everywhere, but both historical precedent and current research suggest the setup for equities remains stronger than many realize.
Sometimes the most hated rallies are the ones that last the longest.
History doesn’t guarantee the future, but it offers perspective. And right now, the perspective is leaning much more optimistic than the headlines might have you believe.
It’s easy to get caught up in the daily noise and fear-driven narratives. But history reminds us that:
Fed cuts near highs have not derailed markets — they’ve often fueled them.
Strong quarters tend to build momentum, not kill it.
No signal is perfect, but when all three of these line up, it’s worth paying attention, especially in a moment when so many expect the opposite.
Disclaimer: This commentary is for informational purposes only and should not be considered investment advice. Past performance is not indicative of future results. Please consult with your financial advisor before making investment decisions.